
A campaign’s overall numbers can look fine while it’s quietly losing impressions to a tight budget, burning spend at 3am, wasting clicks on tablets, or paying for clicks from a city that never converts. Segments & Opportunities is four focused breakdowns in one page - Impression Share, Dayparting, Device, and Geo - each one built to answer a single question: where specifically is this campaign leaking money, and what should you do about it.
Where to find it & plan availability
Go to Optimize → Segments in the left sidebar, or open /dashboard/segments directly. The entire page is free on every plan - none of its four tabs are gated. It’s read-only reporting: there are no apply/exclude/bid-adjustment buttons here, just the numbers and a plain-language recommendation per row.
Step-by-step walkthrough
1. Impression Share - why you’re not winning every auction
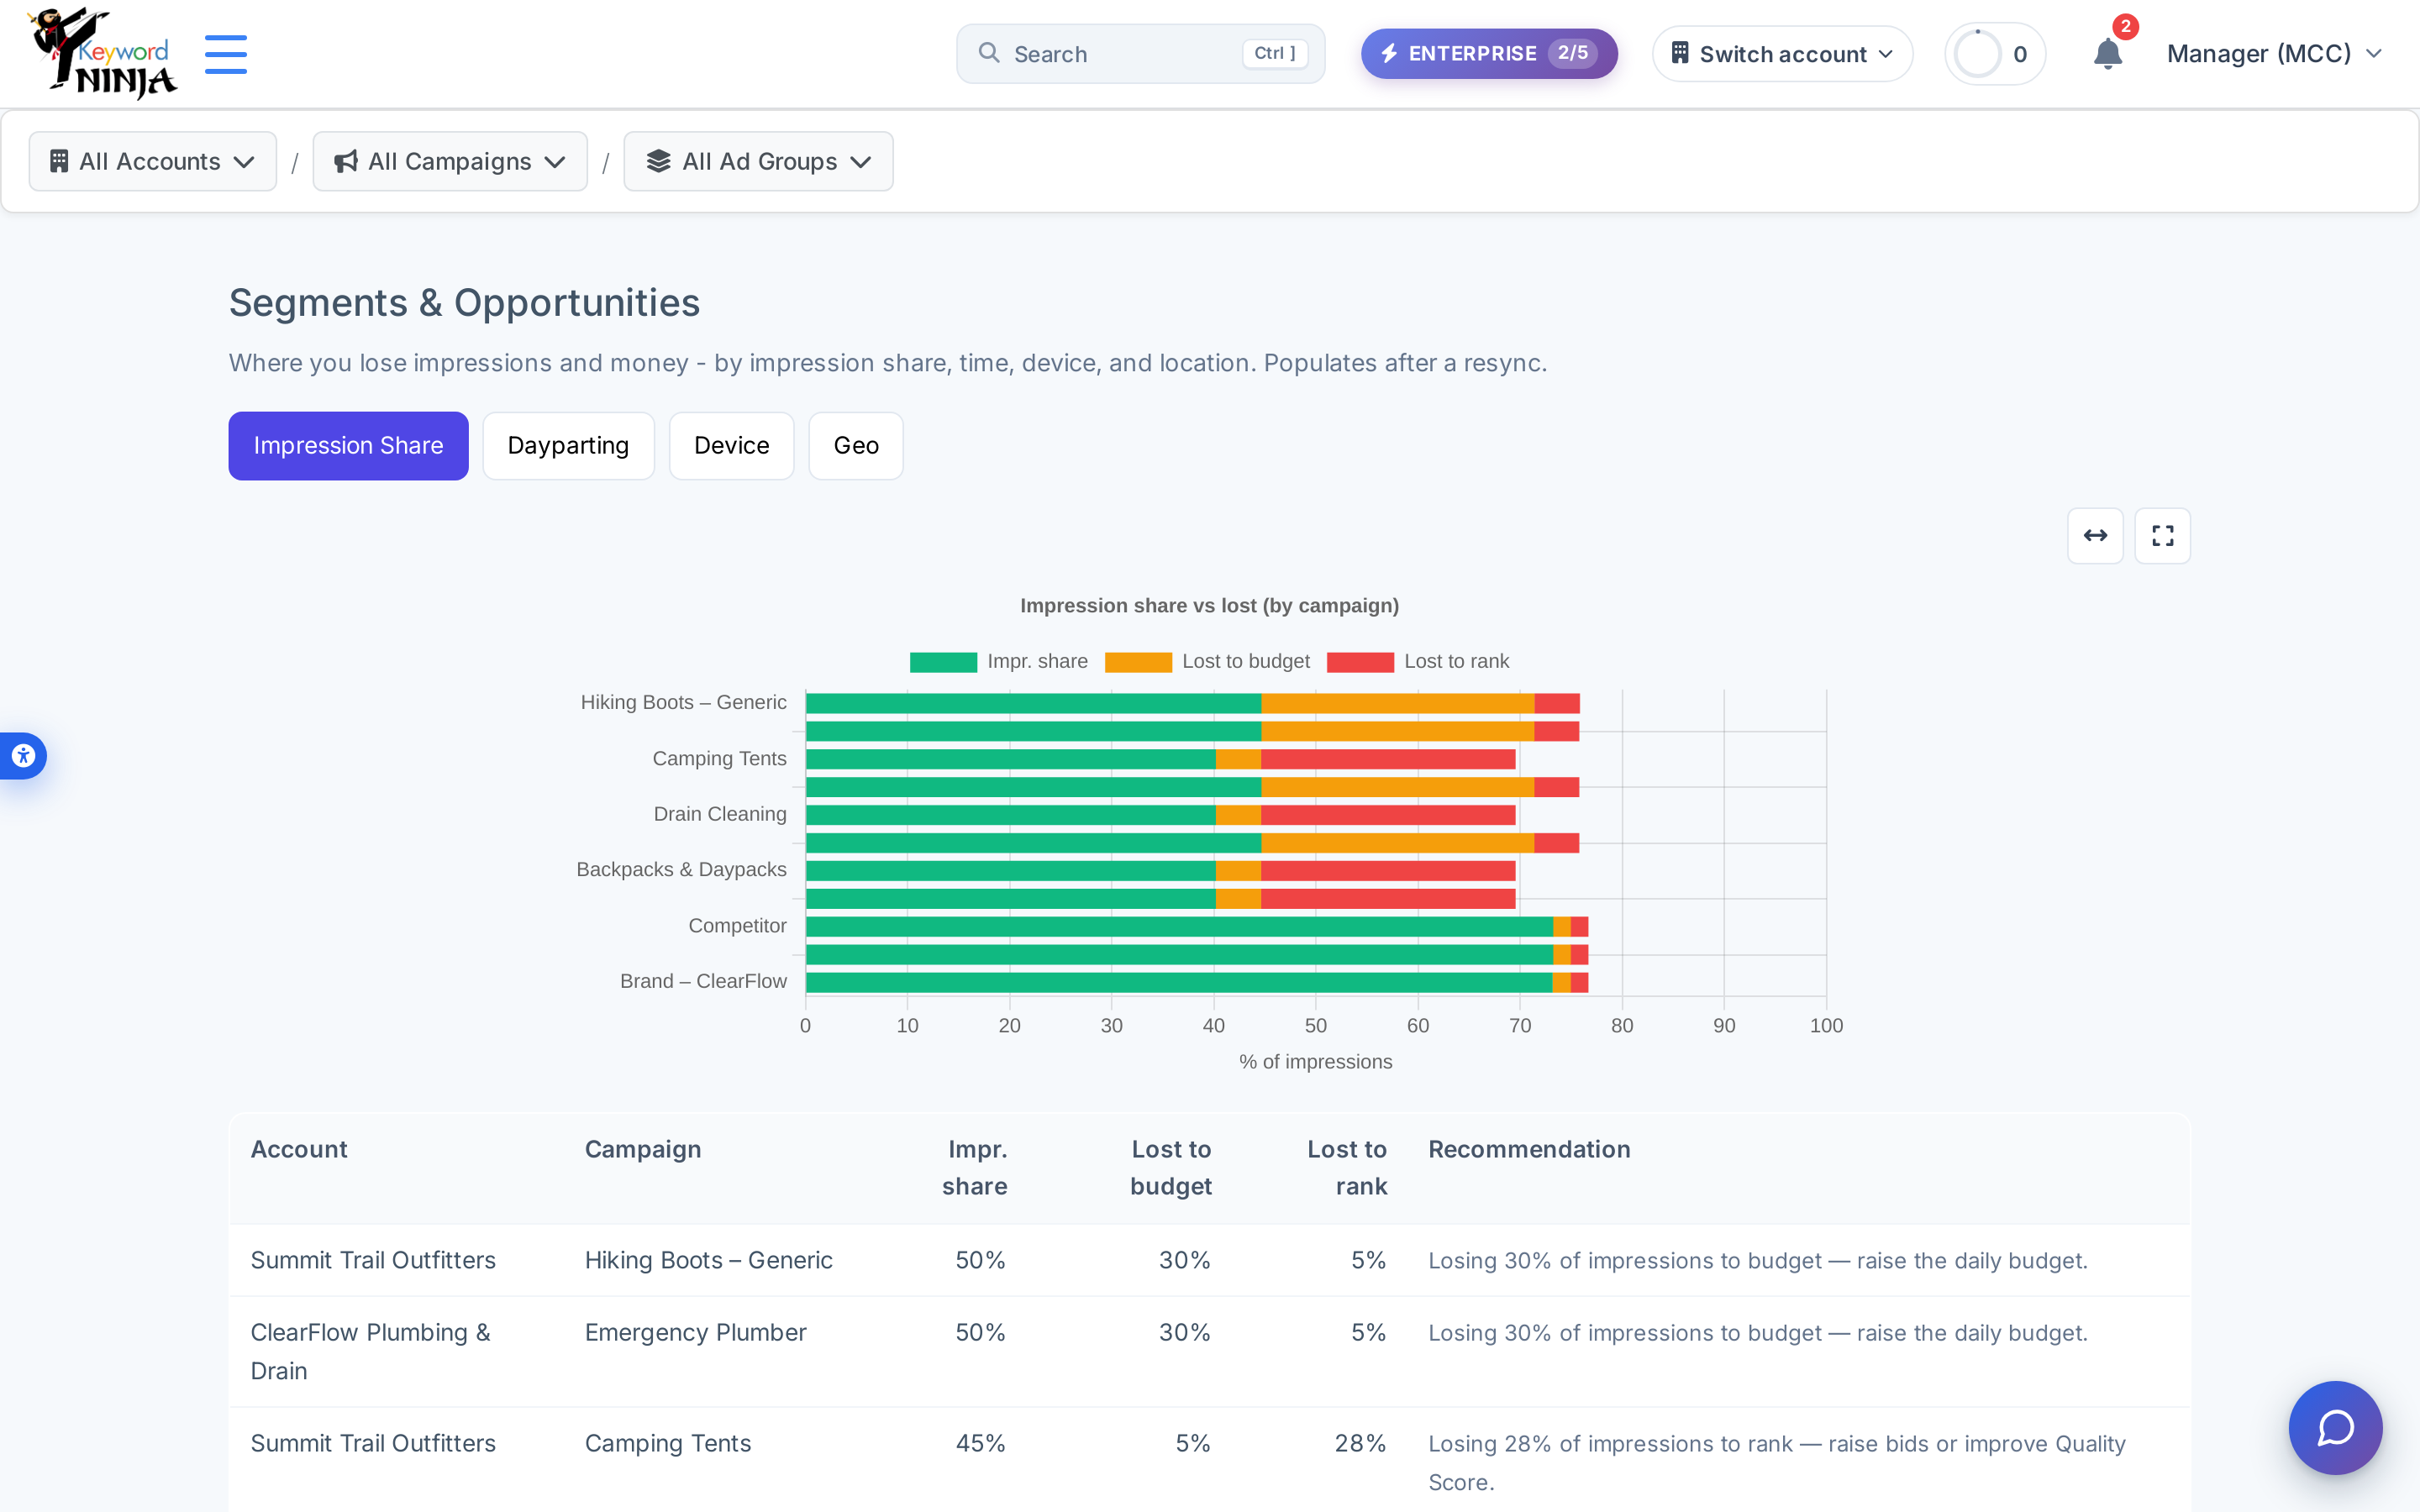
The default tab shows, per campaign, how much of the available impression share you’re capturing versus losing to a tight budget or a low rank (bid/Quality Score). The stacked bar makes the split obvious at a glance; the table below spells out which lever to pull for each campaign.
2. Dayparting - which hours are worth bidding down
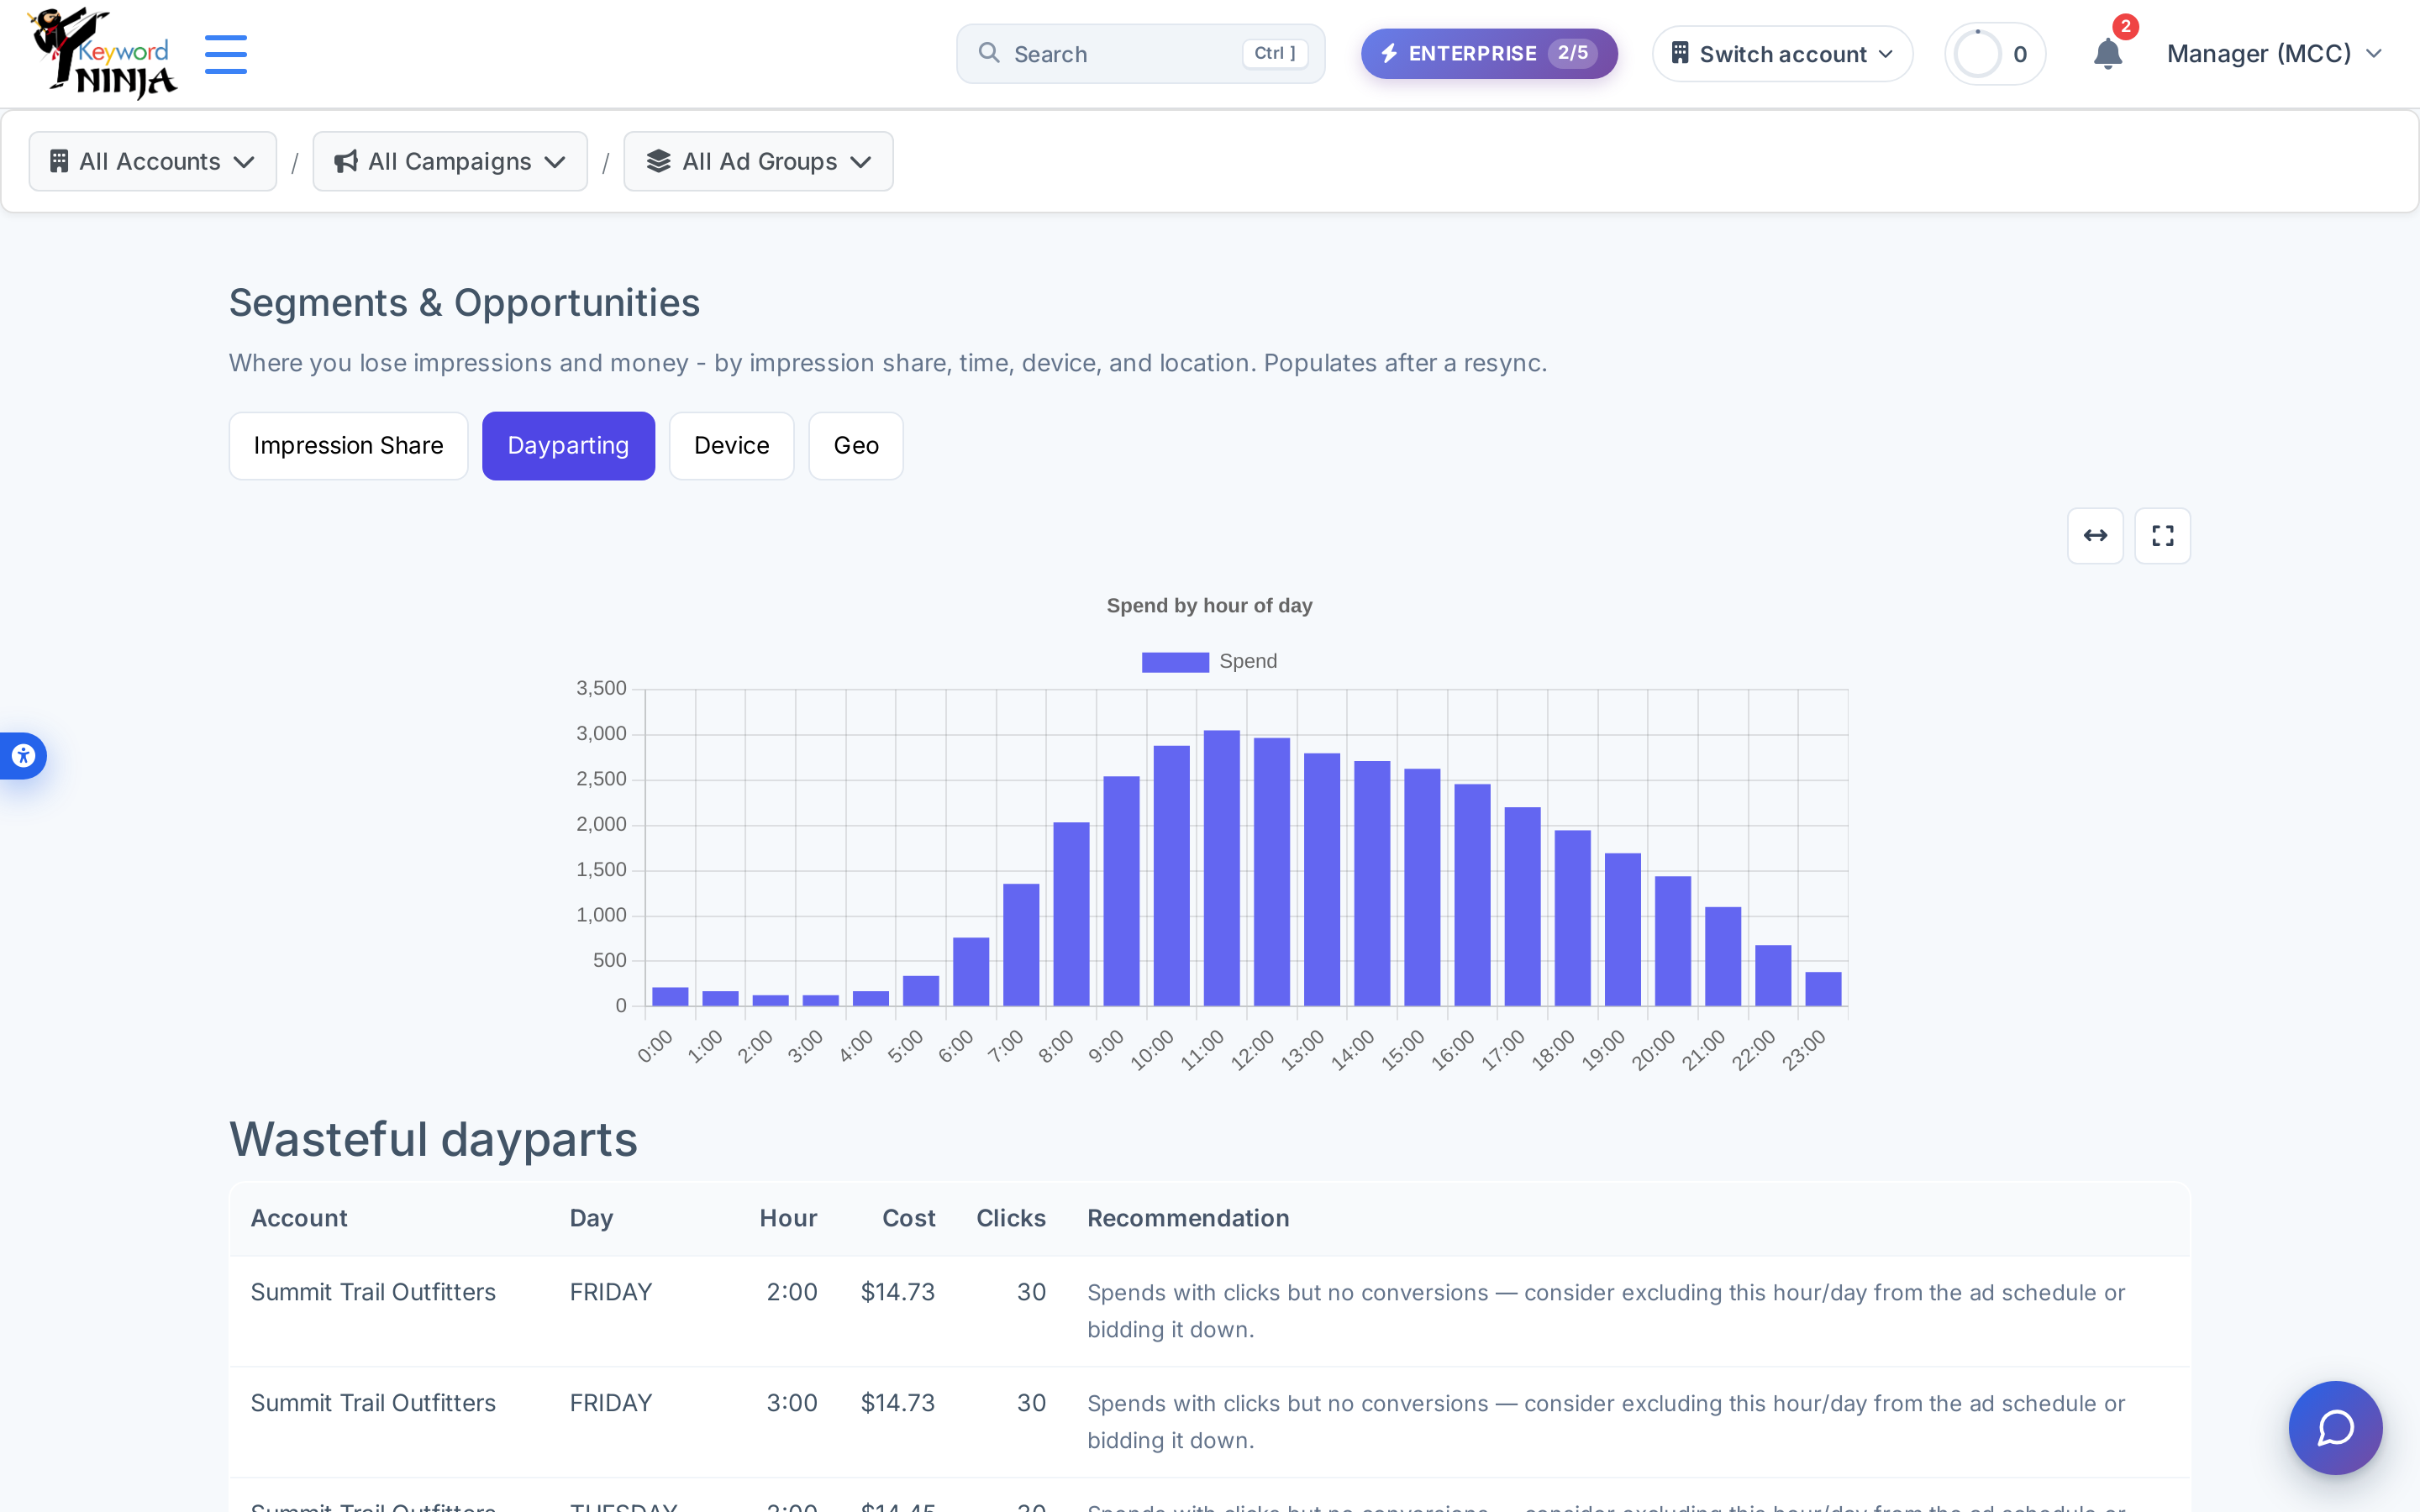
Switch to Dayparting to see total spend by hour of day and a “Wasteful dayparts” table listing the exact day/hour combinations that spent money with clicks but zero conversions - the candidates for an ad-schedule exclusion or bid adjustment.
3. Device - which device is worth a negative bid modifier
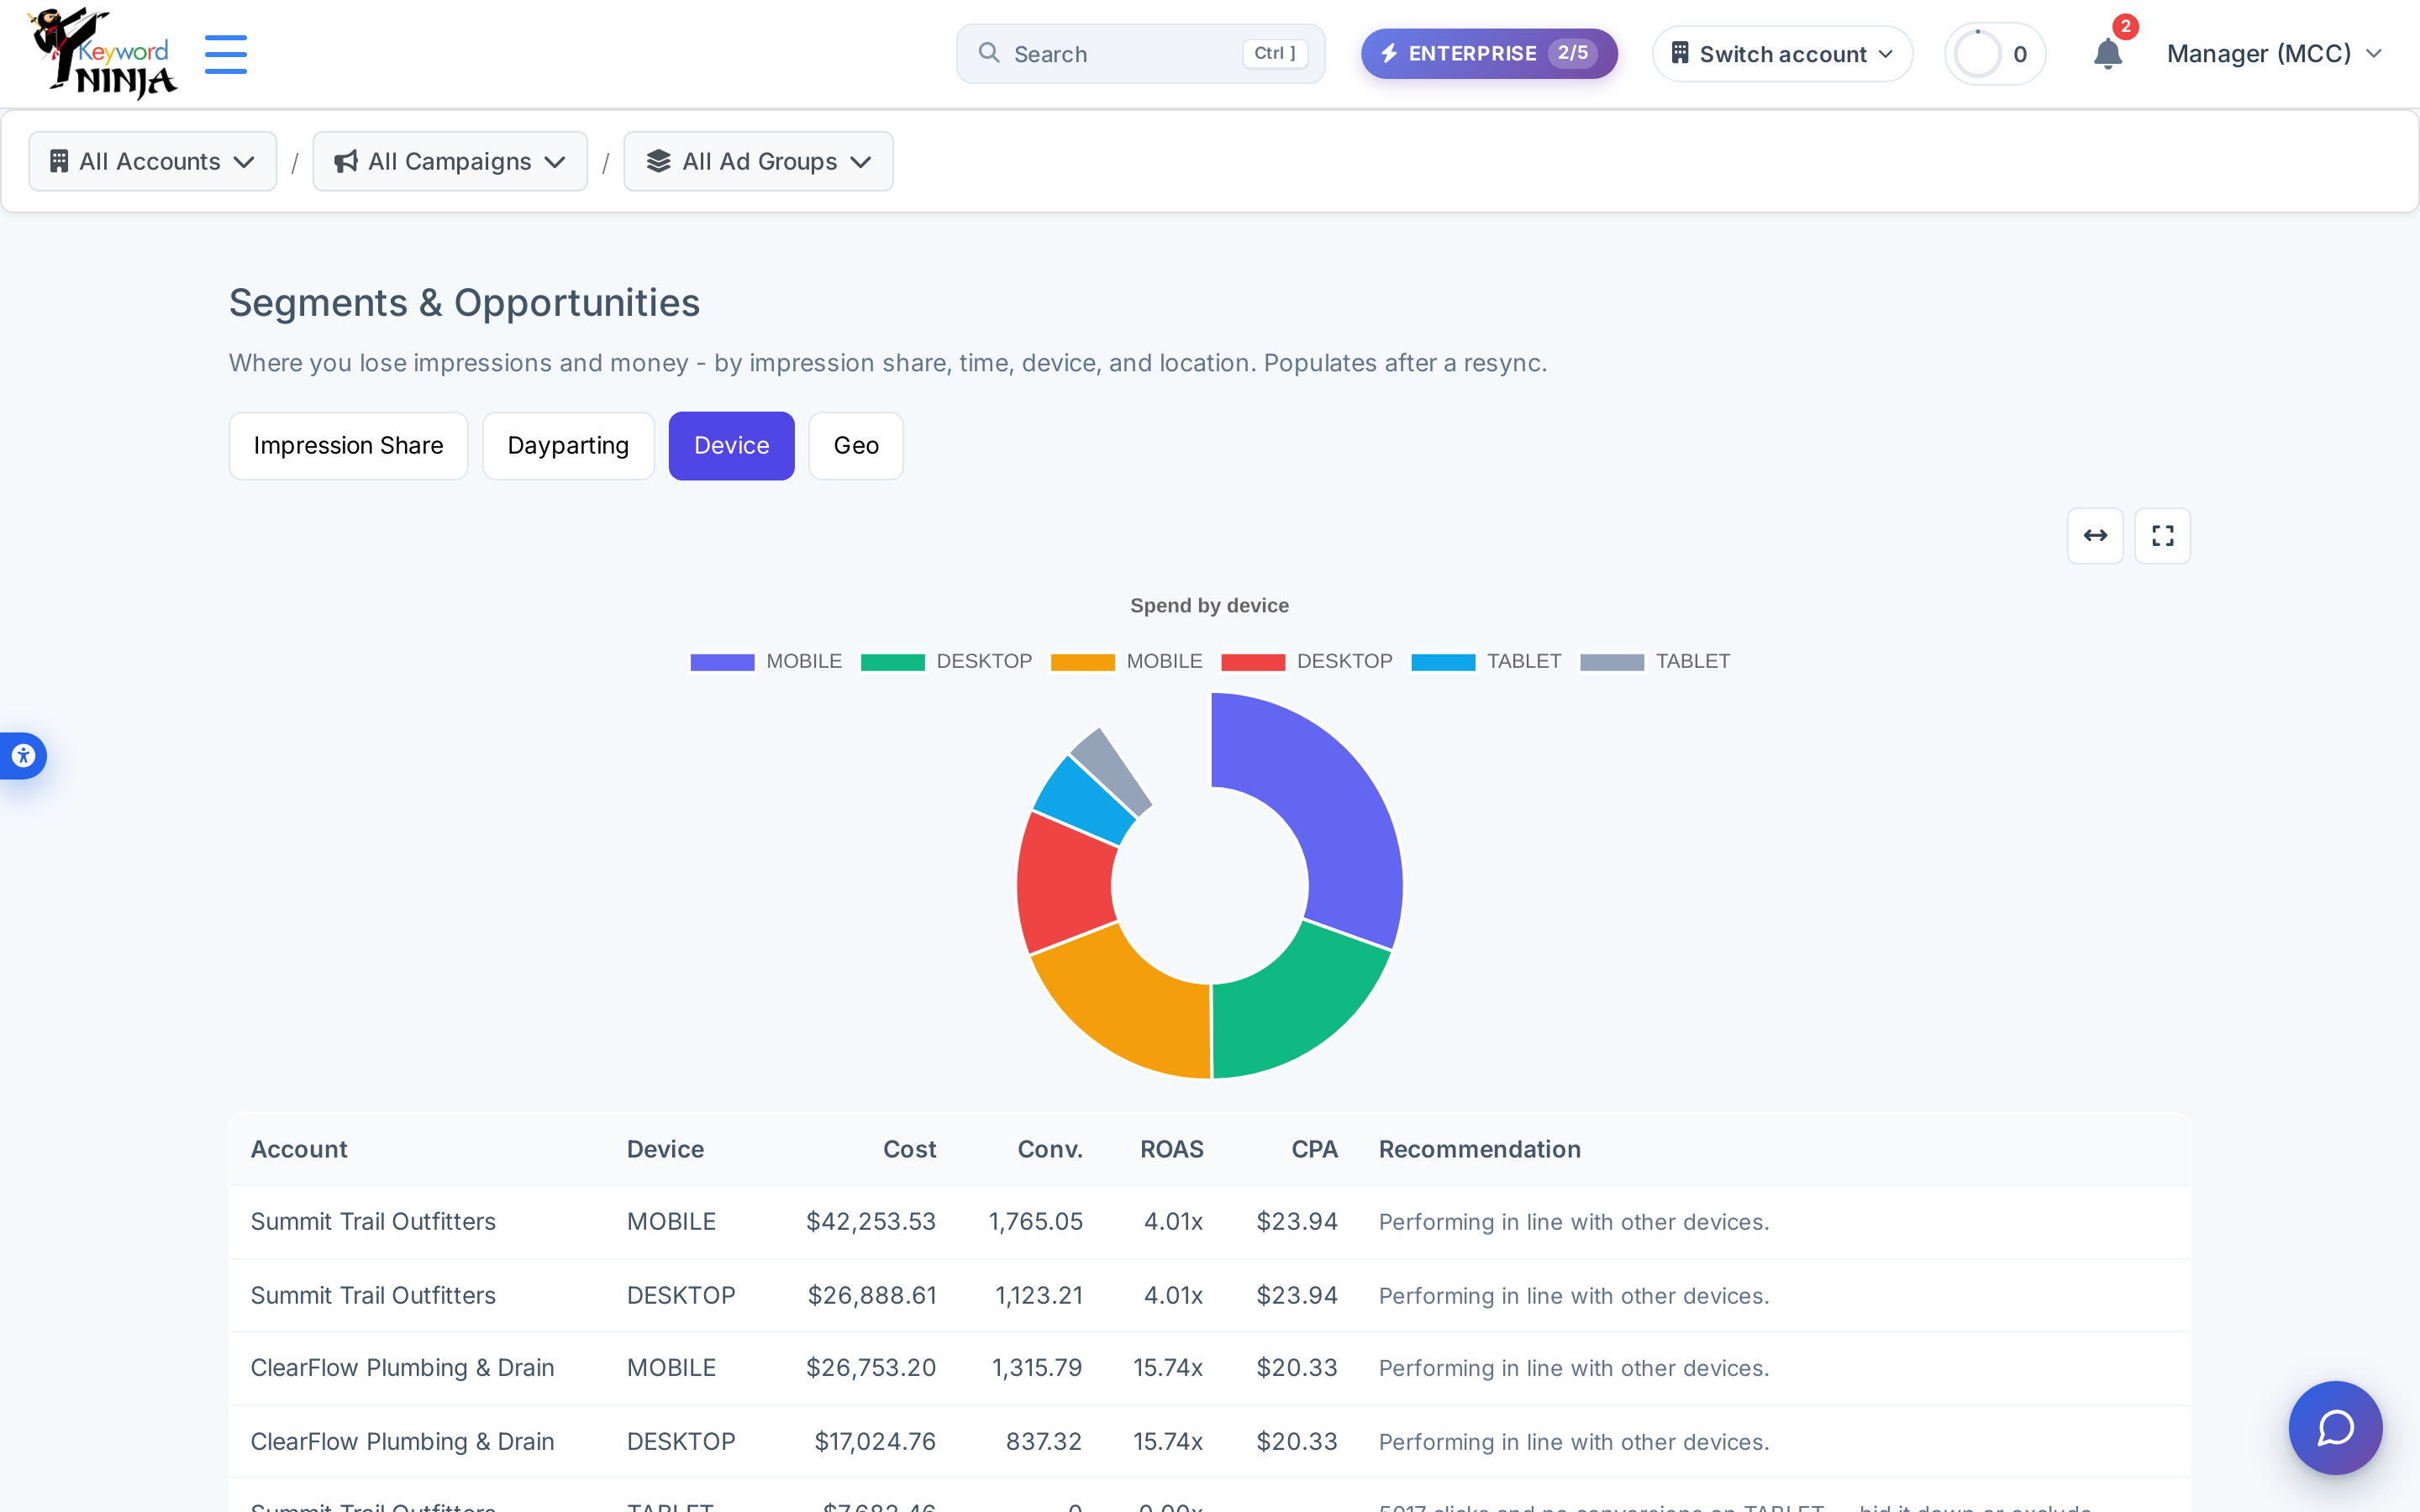
The Device tab totals cost, conversions, ROAS, and CPA per device (mobile/desktop/tablet) and flags a device for a bid-down either when it has clicks with zero conversions, or when its CPA runs well above your best-performing device.
4. Geo - which locations are burning budget with nothing to show
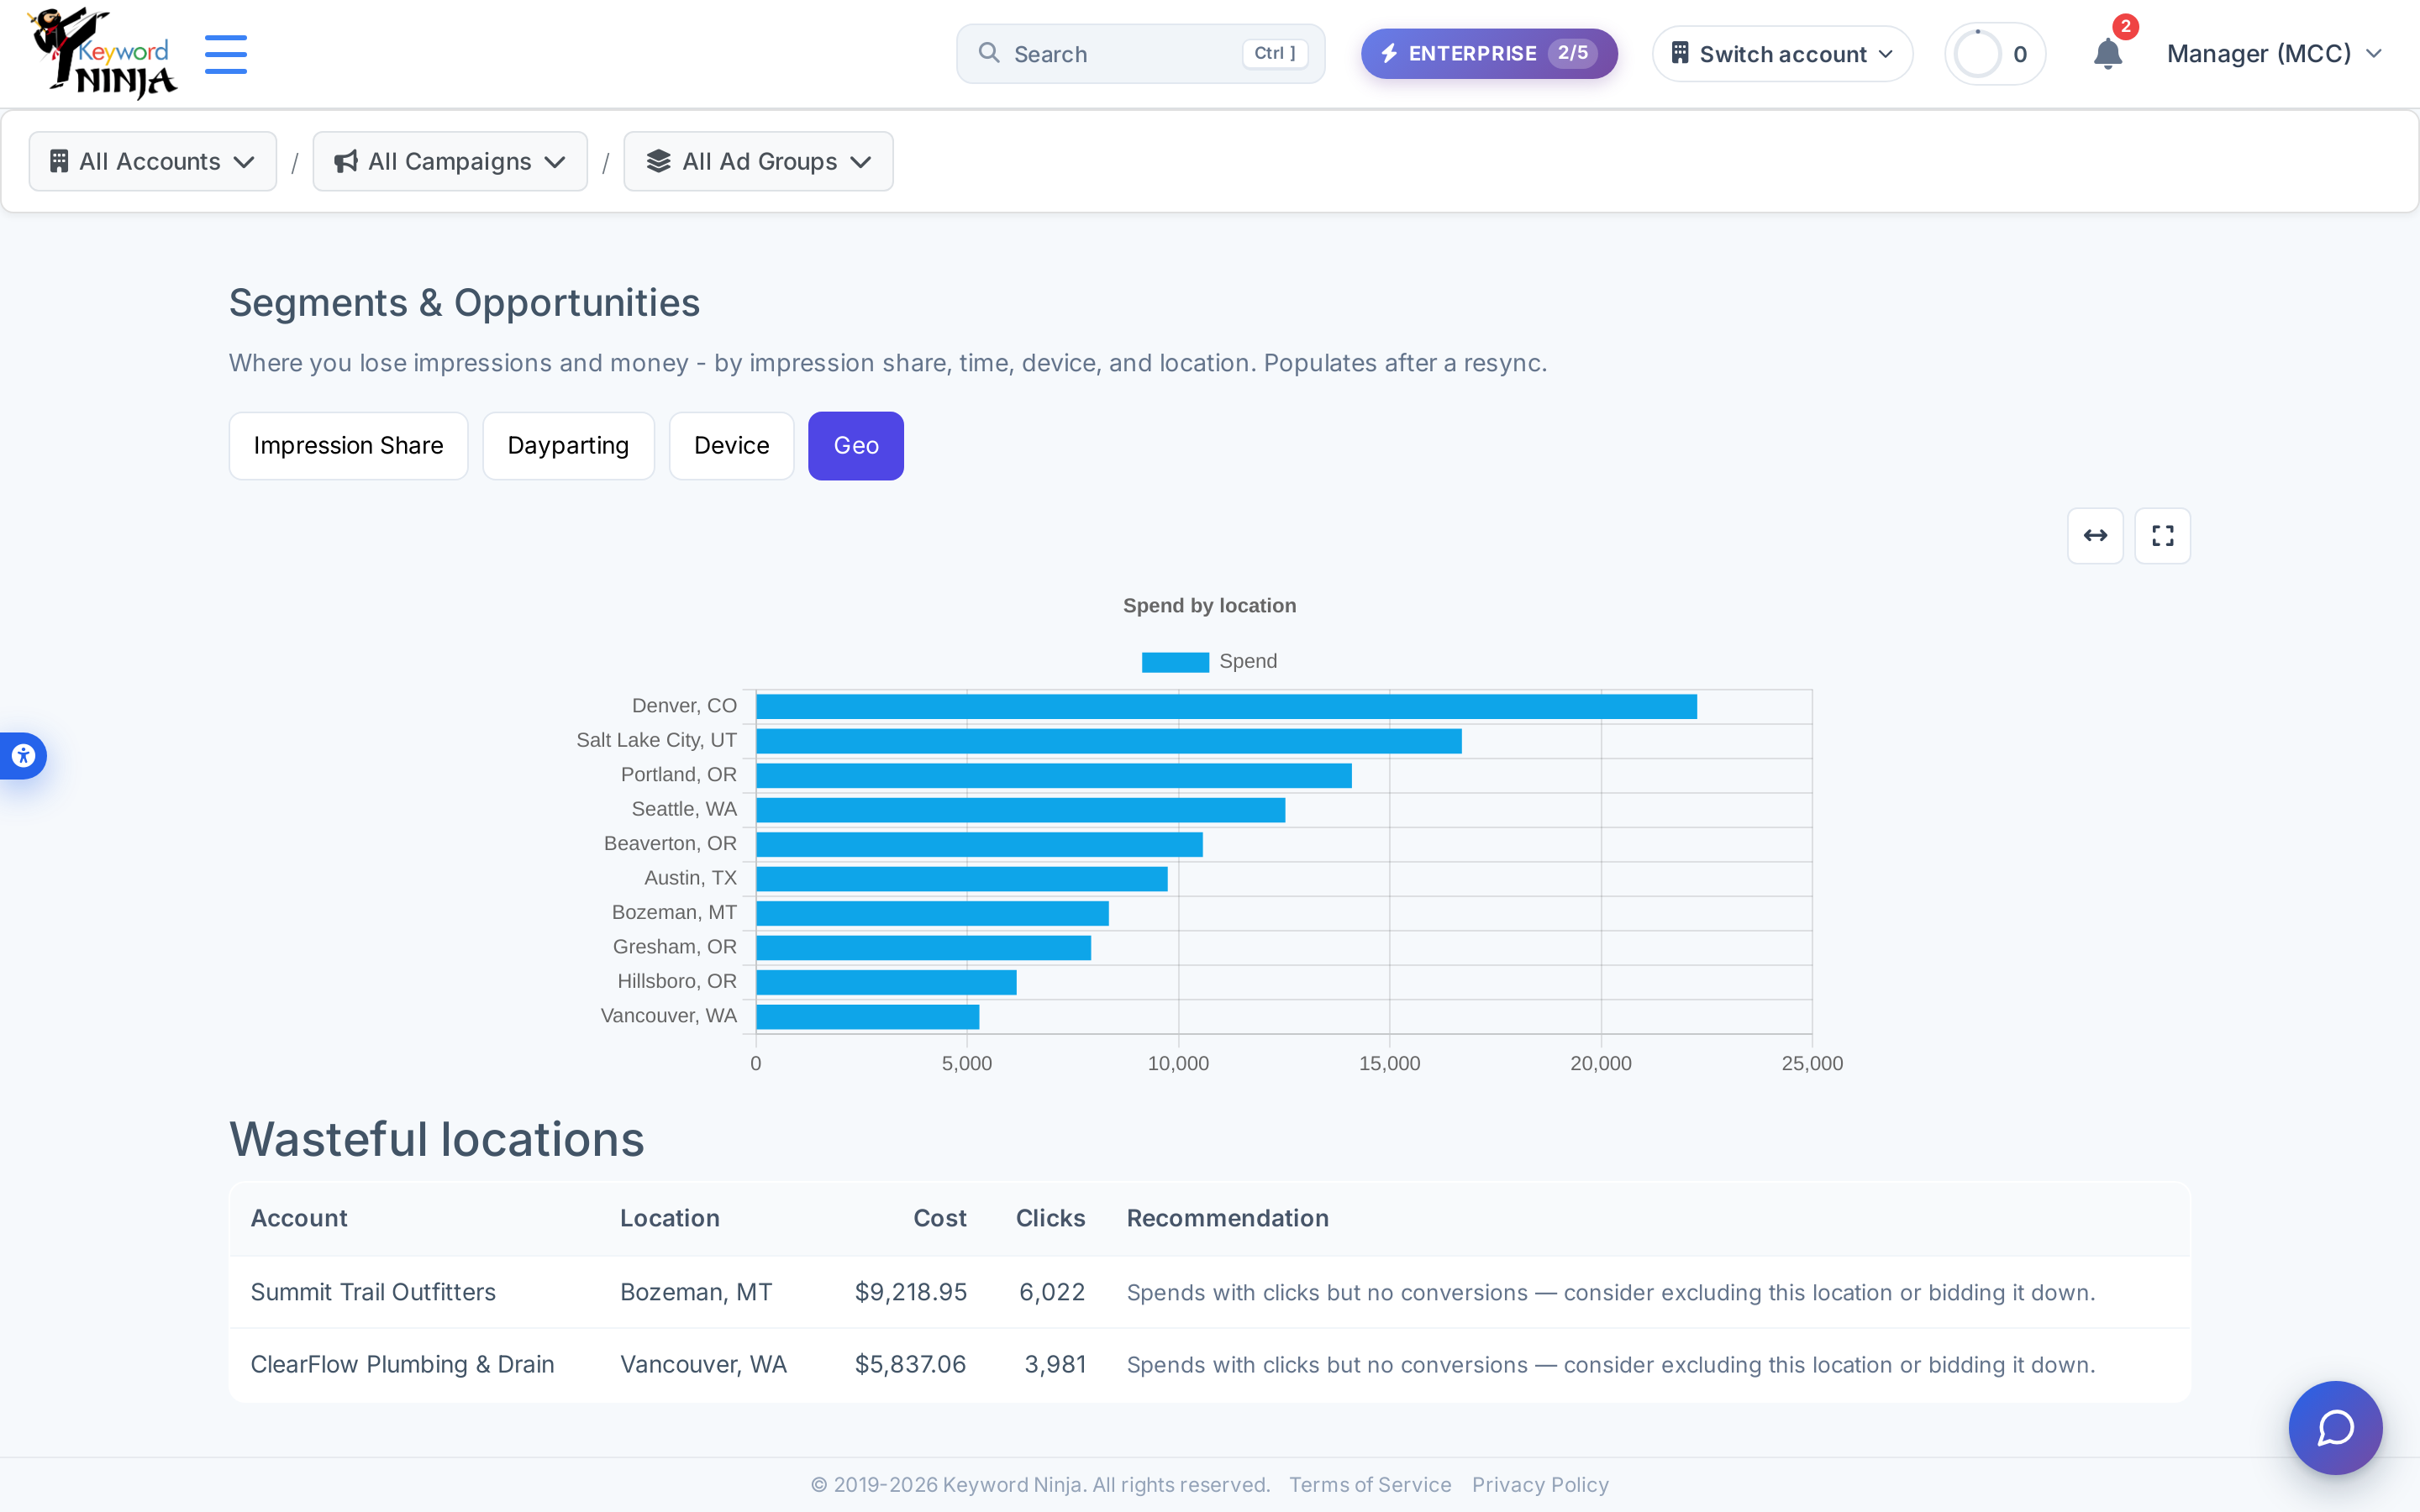
The Geo tab breaks the same story down by location, plus a “Wasteful locations” table for any city/region spending real money on clicks that never convert.
Tips & best practices
- This page is diagnostic, not an action button. Once you’ve spotted a wasteful hour, device, or location here, go make the actual change in Google Ads (or via campaign-level bid adjustments) - there’s no apply/exclude action on this page itself.
- Impression Share recommendations are mutually exclusive by design. A campaign gets “raise the daily budget” only when it’s losing more to budget than to rank, and vice versa - if both numbers are small, you’ll see “not materially losing impression share” instead.
- The wasteful thresholds require real spend, not just activity. Dayparting/Device/Geo only flag a bucket as wasteful once it’s spent a meaningful amount with clicks and zero conversions - a single stray click doesn’t trigger a false alarm.
- All four tabs share the same breadcrumb scope. Narrowing to one account or campaign re-fetches all four tabs identically, so you can drill from “which campaign is losing impression share” straight into “which hour/device/location is the actual culprit” without re-navigating.
- The recommendation sentences are plain English regardless of site language. The page chrome, tab labels, and table headers are fully bilingual, but the “Losing X% of impressions to budget…” / “Spends with clicks but no conversions…” recommendation text itself is composed server-side and isn’t re-generated per language - confirmed live on the Hebrew screenshots above.
Troubleshooting & FAQ
A tab shows “No data yet - resync this account to populate.” Dayparting, Device, and Geo depend on data that’s only populated by a Google Ads sync covering that dimension - give the account a resync if it’s been a while, or if this is a newly connected account.
Impression Share shows dashes or “not materially losing impression share” for every campaign. That’s a real, healthy result - it means Google Ads isn’t reporting meaningful lost impression share for those campaigns in the selected window, not a data problem.
Why does the Device chart show the same device twice? With multiple accounts in scope, each account’s device slices are shown separately rather than merged - “MOBILE” for Account A and “MOBILE” for Account B appear as two distinct chart segments. Narrow the breadcrumb to one account for a single per-device breakdown.
A campaign doesn’t appear on the Impression Share tab at all. That tab only includes ENABLED campaigns with at least 100 impressions in the selected window - paused campaigns or very low-traffic campaigns are excluded rather than shown with misleading near-zero numbers.